GDP and Mortgage Interest
As a supplement to the GDP report, the Bureau of Economic Analysis provides an estimate of aggregate mortgage interest and the effective rate of interest on mortgage debt outstanding. It should come as no surprise that the effective interest rate is increasing.

Click on graph for larger image.
After twenty years of declining rates, the effective rate has risen modestly since early 2004.
What is surprising is the estimated large increase in mortgage debt in Q1 2006. The actual number will be reported in the FED’s Flow of Funds report, due on June 8th, but it appears total mortgage debt increased about $300 Billion in Q1, or at about a 13% annual rate.
In Q4 2005, mortgage debt increased 13.2% (annual rate), down from 14.9% in the third quarter. The large increase in mortgage debt is surprising because mortgage refinance activity has fallen steadily according to the Mortgage Bankers Association, and home sales have decreased in Q1. Perhaps this increase is due to homeowners using their Home Equity lines (included in the mortgage data).
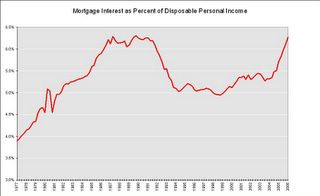
It is also no surprise that mortgage interest, as a percent of Disposable Personal Income (DPI), has risen sharply in recent years.
This calculation is similar to the FED’s Financial Obligations Ratio (FOR) except this is only for the mortgage interest payment. The current ratio is near the all time high that preceded the previous housing bust. This time the ratio will probably go higher since rates are increasing and there are a substantial number of ARMs that will adjust over the next couple of years.
This data shows that homeowners are still using their homes as ATMs. As Paul Volcker said last year:
“Homeownership has become a vehicle for borrowing and leveraging as much as a source of financial security.”
Best to all, CR Calculated Risk

