Another Look at Drug Pricing, Costs, and Why
Median total costs Table for the most common prescriptions of each of the 49 high-volume brand-name drugs from 2012 through 2017 as detailed in JAMA Network Open’s “Trends in Prices of Popular Brand-Name Prescription Drugs in the United States” 2019.”
A Bit of A Summary: This particular table relates back to a post I wrote; Does Trump Read JAMA Network Open? which reviewed the latest JAMA findings (Trends in Prices of Popular Brand-Name Prescription Drugs in the United States) on pharmaceutical price increases from 2012 to 2017. It is another in a series of articles which have looked at the rising prices of pharmaceuticals. The World Health Organization (2018) findings reflected on R & D costs for cancer drugs and the amount of time needed to recoup those costs (median of 3 years for $750 million) with an average return of $14. 50 for every $1 invested in R & D for cancer drugs. For the maximum estimated risk-adjusted cost of R&D (US$2.827 BN), the time to cost recovery was 5 years (range: 2 years; 10 years, n=56).
Click on the JAMA Table: Median Total Cost of Top-Selling Brand-Name Drugs 2012 – 2917 to enlarge and again to magnify if needed.
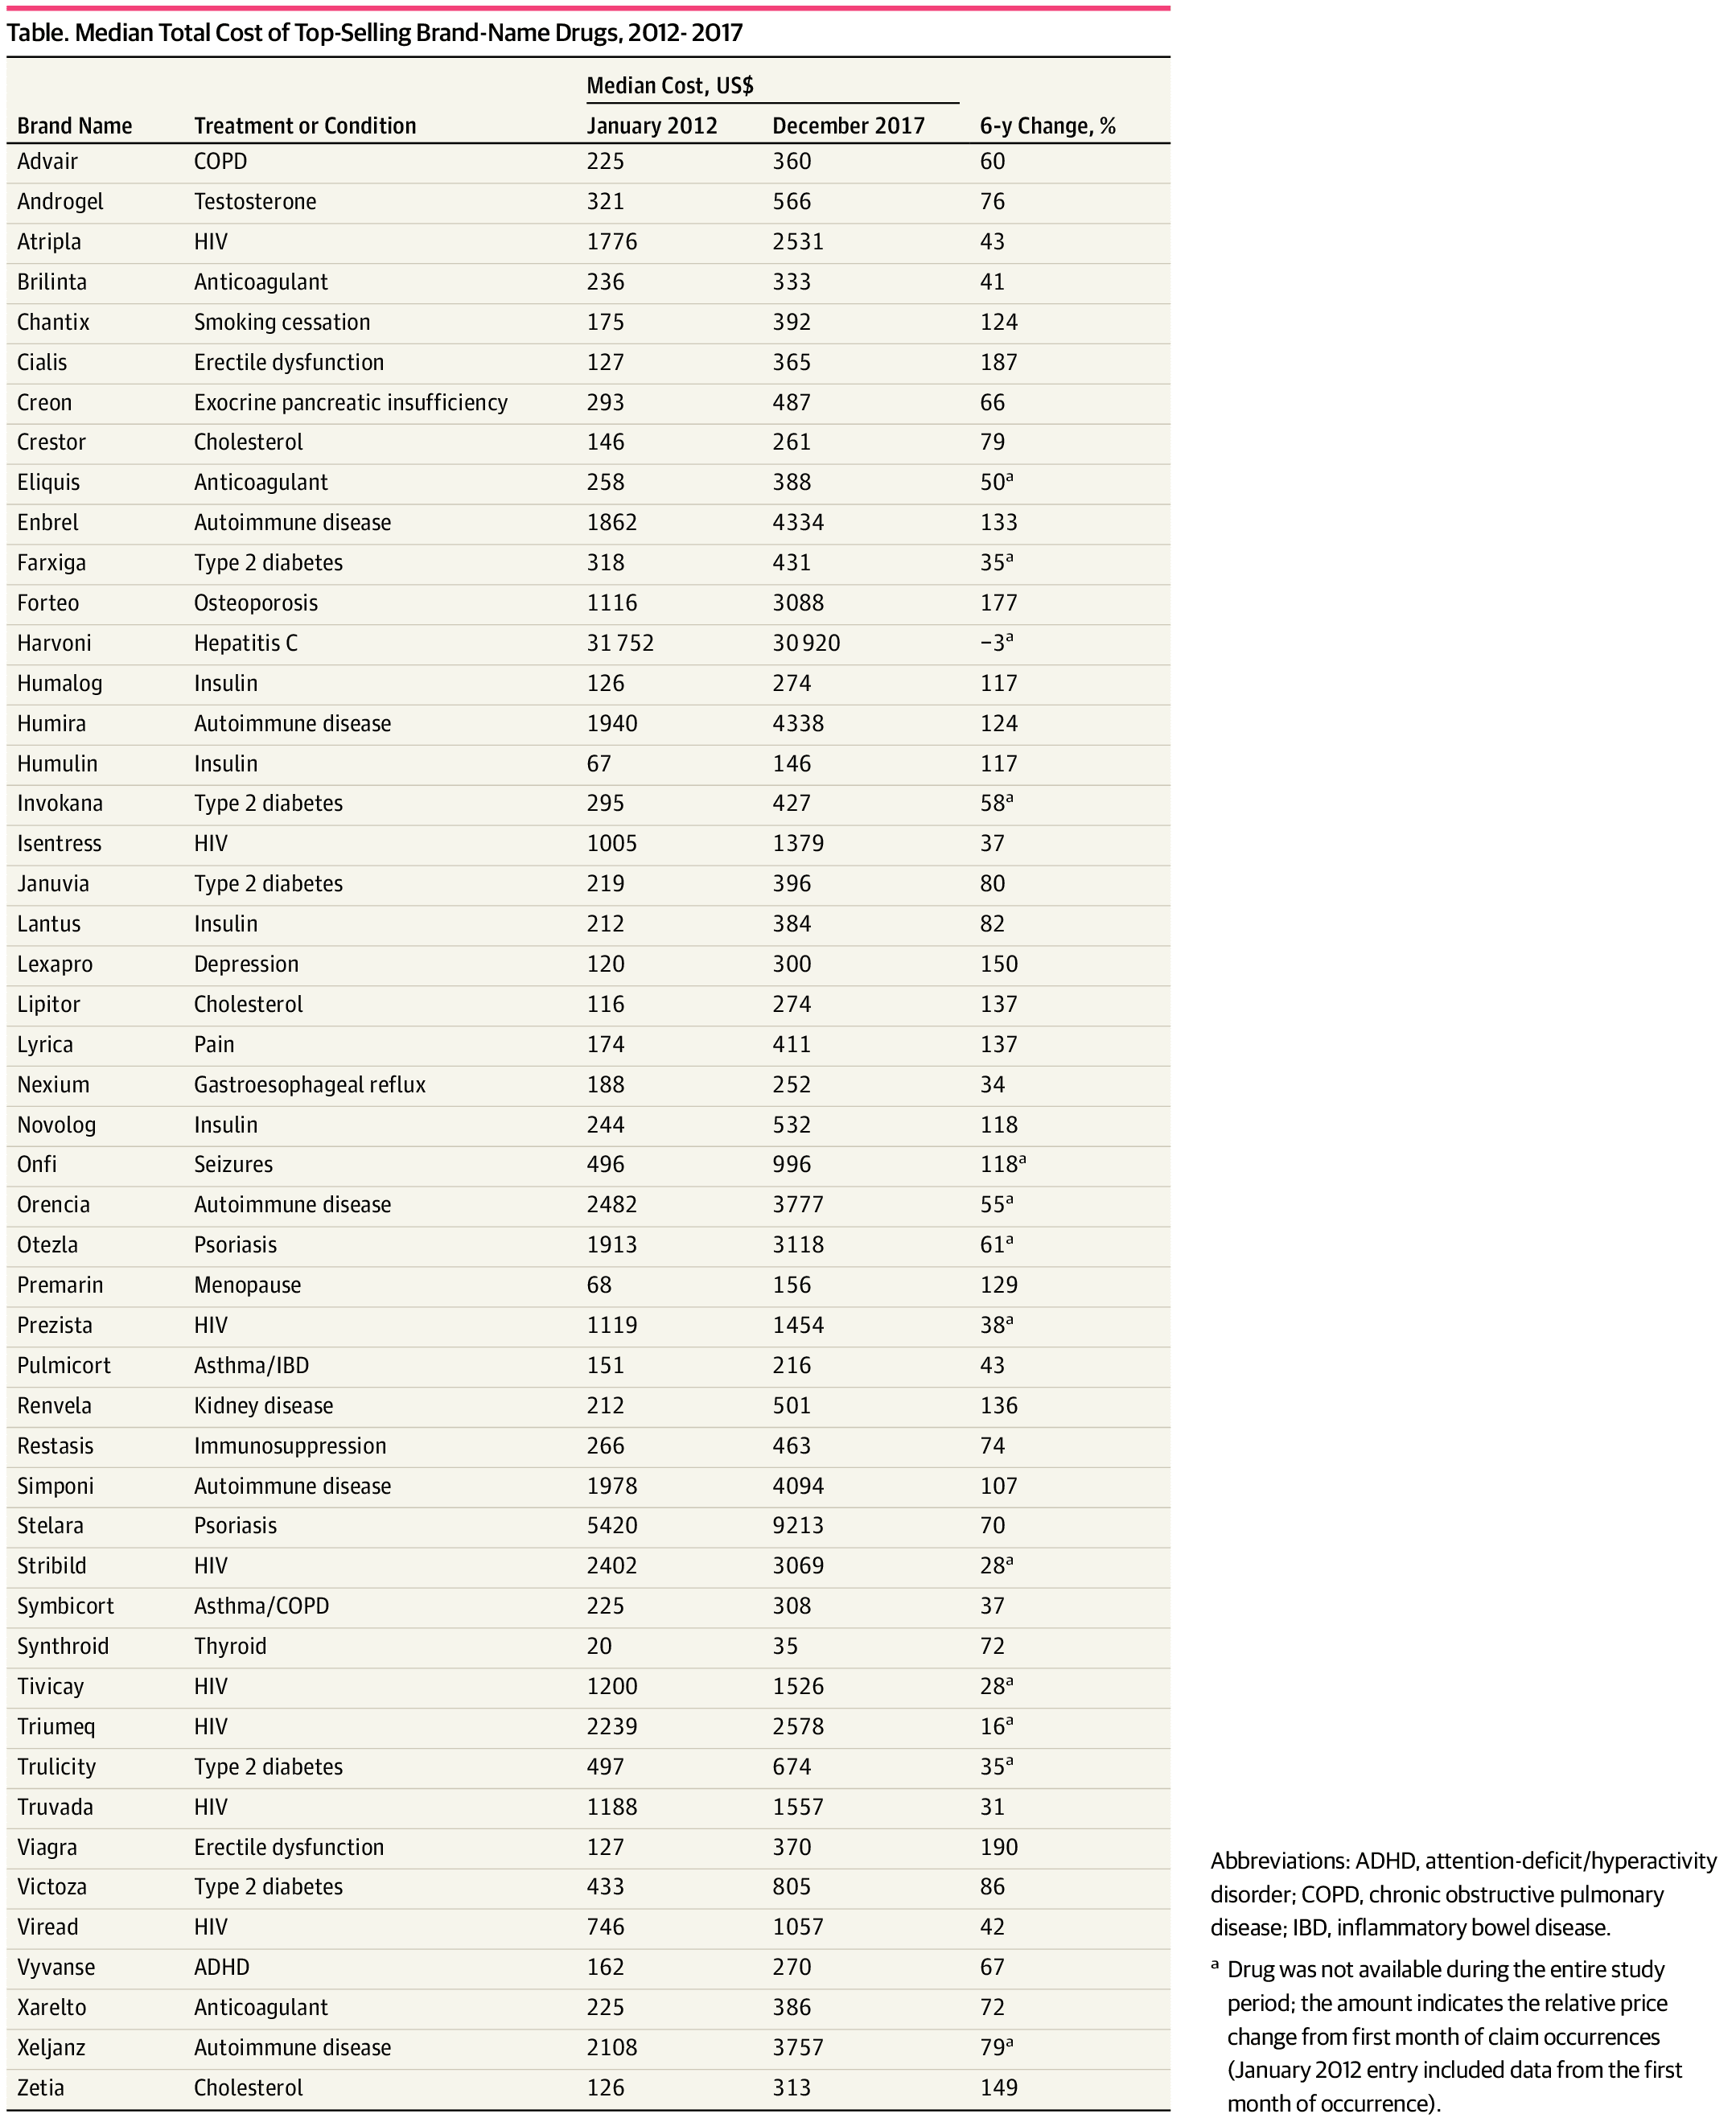
Taken “From the Trends in Prices of Popular Brand-Name Prescription Drugs in the United States” findings, substantial cost increases among these drugs was near universal, with a 76% median cost increase from January 2012 through December 2017, and almost all drugs (48 [98%]) displaying regular annual or biannual price increases. Of the 36 drugs available since 2012, 28 (78%) have seen an increase in insurer and out-of-pocket costs by more than 50%, and 16 (44%) have more than doubled in price. Insulins (ie, Novolog, Humalog, and Lantus) and tumor necrosis factor inhibitors (ie, Humira and Enbrel) demonstrated highly correlated price increases, coinciding with some of the largest increase in drug costs. Relative price changes did not differ between drugs that entered the market in the past 3 to 6 years (2012 – 2017) and those having been on the market longer (number of drugs, 13 vs 36; median, 29% increase from January 2015 through December 2017; P = .81) nor between drugs with or without a Food and Drug Administration – approved therapeutic equivalent (number of drugs, 17 vs 32; median, 79% vs 73%; P = .21). Changes in prices paid were highly correlated with third-party estimates of changes in drug net prices (ρ = 0.55; P = 3.8 × 10⁻⁵), suggesting that the current rebate system, which incentivizes high list prices and greater reliance on rebates, increases overall costs.

The ICER Report (Unsupported Price Increase Report) compared the percentage increases in the Wholesale Acquisition Cost (WAC – second Column) to the increase in the Medical Care Consumer Price Index (CPI) over the same period and excluded those drugs with a WAC increase less than 7.32% or two times the increase in Medical Care CPI over the same period. The medical care CPI is one of eight major components of the CPI recorded and reported by the US Bureau of Labor Statistics .
CPI for Medical consists of medical care services (professional services, hospital and related services, and health insurance) and medical care commodities (medical drugs, equipment, and supplies). ICER using overall Medical CPI and not a lone services or commodity related one or subcomponent(s) of either or each was to reflect increases in drug prices relative to inflation in the overall price of medical care. The 77 drugs shown in the ICER Table 2.2 had an increase in Wholesale Acquisition Cost (WAC) greater than 7.32% over the two-year period (4th quarter 2016 – 4th quarter 2018). The remaining 23 drugs were excluded from further analysis even though they may have been greater than one times CPI.
The ICER Table 2.3 depicting 9 drugs of the 77 shows the percentage change in net price (Column 3) over the two-year period from the fourth quarter of 2016 to the fourth quarter of 2018, and the and the increase in drug spending during calendar years 2017 and 2018 and the 4th column depicts net revenue after discounts, rebates, concessions to wholesalers and distributors, and patient assistance programs same as Table 2.2 in the report. Only the ICER Table 2.3 is shown here (JAMA chart above).
The first seven drugs under assessment did not display evidence meeting the criteria accepted evidence grading system called GRADE. As a result, the seven are reported as having price increases “unsupported by new clinical evidence.” GRADE is a method used by systematic reviewers and guideline developers to assess the quality of evidence and decide whether to recommend and intervention. GRADE differs from other appraisal tools for three reasons: (i) because it separates quality of evidence and strength of recommendation, (ii) the quality of evidence assessed for each outcome, and (iii) observational studies can be ‘upgraded’ if they meet certain criteria.
So What Does All of This Mean?
Other reports recognize similar. Healthcare costs are increasing at a much higher rate than inflation, enough so, JAMA is reporting patented pharmaceutical price increases to be 50% to 100% between 2007 and 2014, as are the generic versions, and those introduced during 2007 and 2014 have seen similar sizeable increase. The exhibited JAMA report details the increases.
The ICER report goes a bit further and establishes a benchmark of increase at twice Medical CPI and whether a price increase greater than the benchmark can be justified by the result of significant value brought to the market to account for the increase. At greater than a generous twice Medical CPI, the top nine drugs exceeded this benchmark and after investigation, did not bring significant value to the market place following the 4 significant values claimed by pharmaceutical companies. This analysis was completed on 9 of 77 drugs having price increases greater than twice Medical CPI. Seven of the nine drugs were shown to have price increases for which additional value could not be substantiated. The remaining two had evidence of clinical value which could not be examined at this time. Then there is the balance of the 77 drugs which have had price increases greater also. Legit or not?
Remember, the ICER is the organization which justifies pricing for many of the new drugs coming to the market place.
The World Health Organization Report reviews the costs of R & D for Cancer Drugs which pharmaceutical companies blame as a the major factor for higher prices over the life of their patents. The WHO document reports the R & D costs are recouped in a median 3 to 5 years for R & D investments of $750 million to $2.8 Bn. Drug patents are significantly long than the recovery. Rent taking . . .
This is just pharma alone and I did not look at hospitals, clinics or hospital supplies. Briefly, “Health Affairs – Hospital Prices Grew Substantially Faster Than Physician Prices For Hospital-Based Care In 2007–14″ reports inpatient care at hospital prices grew 42 percent, while physician prices grew 18 percent. Similarly, for hospital-based outpatient care, hospital prices grew 25 percent while physician prices grew 6 percent. Both this report and Kocher and Berwick’s “While Considering Medicare For All: Policies For Making Health Care In The United States Better: Health Affairs” point to increases in hospital care as the leading cause of increased healthcare insurance premiums.
The emphasis by politicians has been on the pricing of drugs without looking at the supply chain and the PBM’s influence on it; without looking at the costs of R & D, the return from sales revenue and how quickly those costs are recovered; and without looking at the exclusivity granted drugs through patents that allow the ability to increase pricing without a returning benefit clinically, socially, to the system, and most of all to the patient. The emphasis by government should be a review of drug costs to establish a fair market value/price. I do not see a foundation being established for the setting of pricing.
Trends in Prices of Popular Brand-Name Prescription Drugs in the United States, JAMA Network Open, Nathan E. Wineinger; Yunyue Zhang; Eric J. Topol, May 2019
Unsupported Price Increase Report, Institute for Clinical and Economic Review; David M. Rind, Foluso Agboola, Varun M. Kumar, Eric Borrelli, Steven D. Pearson; October 2019
Technical Report, Pricing of cancer medicines and its impacts; World Health Organization; 2019
While Considering Medicare For All: Policies For Making Health Care In The United States Better; Health Affairs; Kocher and Berwick; 2019
“Health Affairs – Hospital Prices Grew Substantially Faster Than Physician Prices For Hospital-Based Care In 2007–14;” Health Affairs; Zack Cooper, Stuart Craig, Martin Gaynor, Nir J. Harish, Harlan M. Krumholz, and John Van Reenen; 2019
Run75441 (Bill H)
shorter version:
The entire system is a ginormous mess, largely due to money and politics.
Nice job on a thorough analysis.
Tom:
Coming from you who I believe was also in the industry, that is nice compliment. The ICER publishing their document which indicted seven of the 77 drugs as not having justifiable price increases tied it altogether for me. I had the Health Affairs, JAMA, WHO, etc. information already. I just needed someone to say this is an issue. Looking at prices and not investigating costs is a mistake and Congress is concentrating on the former and not the latter. I can not get my congressional rep to pay attention.
When I was doing manufacturing throughput analysis, we were always looking at costs other than Labor. Much of pharma and supplies is just greed.
I have given you a hard time at times, I apologize for doing so. Much of it was unwarranted. I deleted your other comment as I thought this one was the one you intended.
Bill
No need to apologize, I don;t mind give-and-take as long as it is intelligent.
Among my many health care concerns is insulin, me and the bride (RN) have seen too many people scraping for insulin.
But then I have two offices cluttered with health care issues, kill lots of trees.
Thanks, my computer was giving me grief about posting for whatever reason.
Anybody here for pushing Dean Baker’s (at Beat the Press) drug patent solution: simply eliminate all drug monopolies altogether — replace it with a fully government supported research environment? Anybody?
When a drug company comes up with an effective molecule it does not go on the market in competition with all other molecules, like a book might or a new widget might go on in competition with all other books or all other widgets — or even books v. widgets. It goes on the market as an only-one-place-to-get-it, life-or-death, take-it-or-leave-it maximum extortion monopoly.
Wonder how much today’s pharmas would have charged for polio shots for the first 20 years? A lot more kids on crutches. [Fred Hayek and conservative Austrian friends — who saw no problem with free med care — would day: Where is the moral hazard?]
The same pharma researchers could make the same discoveries working or government grants or salaries that they today make working for Wall Street gamblers.
Nothing dumber than having researchers hiding new scientific findings from each other — while scrambling to turn out copy cat drugs. [Where’s the moral hazard?]
Organic medicinal chemist, Dr. Raymond Schinazi, developed two of the most critical anti-HIV drugs while on salary at Emory University. As a founder of Pharmasset corporation he developed a first time ever, 99% cure for Hepatitis C. Gilead bought the patent from Pharmasset. Dr. Schinazi made $446 million for himself. No more patients on crutches but 20,000 die every year for taking the drug to late or not at all.
“Gilead Sciences makes the hepatitis C drugs – Sovaldi and Harvoni – but $85,000 is an only in America price. Sovaldi sells for about $1,000 a pill in the U.S., while a generic version costs only $4 a pill in India. Canada pays $55,000 for a course of treatment. France recently got Gilead down to a price of about $33,000.”
https://www.forbes.com/sites/johnlamattina/2017/07/19/when-it-comes-to-abusive-drug-pricing-dont-confuse-shkreli-with-hep-c-drugs/#34f2a93faf68
Over their 20 year patent runs, Hep C cure manufacturers will charge about $250 billion NOT to cure — NOT to wipe out — Hep C; just to treat the worst suffering victims (who never should have suffered in the first place). Something like 400,000 will die. And we will have more infected patients at the end than at the beginning. [Where’s the moral hazard?]
But look at the bright side – Dr. Schinazi made $446 million. Wouldn’t want him working on government salary — wouldn’t be a free market.