Housing prices and recessions II
I wrote about how high house prices are correlaed with poor growth (partly because that which has gone up goes down). The data set was heroically collected by Jorda, Schularick, and Taylor who also used it for a paper which is actually very worth publishing (and published here).
They find that high housing prices and rapid growth of total credit are correlated with greater severity and duration of the next recession..
I wonder if the bubble and credit growth variables are useful in predicting the occurance of a recession (as well as the severity and duration once one comes).
I guessed that it is hard to predict turning points — in particular high asset prices & rapid expansion of credit may imply that there is trouble ahead, but not how far ahead. But I couldn’t resist a logit with dependent variable “recession” for your definition of recession — a decline in real GDP starting in year t. Also (guessing it would work better) I looked at recession3 which is a peak in the current year or one of the two following years and recession5 which is a peak in the current year or one of the four following years..
To my surprise, the variables work really quite well I think (not surprisingly better for recession3 and recession5).
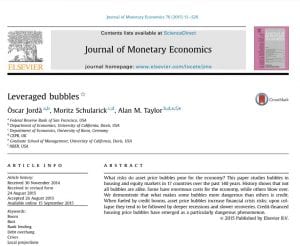
for recession 3 (year to year decline starting in any of three years of real gdp
logit recession3 hpreal tloansgdp lrgdp year cn* if year>1945, cluster(ifs)
hpreal is the nominal price of housing /cpi, tloansgdp is total loans/gdp, lrgdp is ln(rgdp per capita), there are country dummies
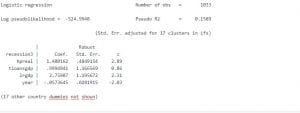
or just for recession (real gdo decline current year to next)
. logit recession hpreal tloansgdp lrgdp year cn* if year>1945, cluster(ifs)
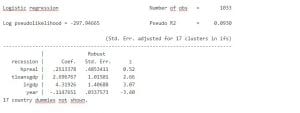
And with recession5
It works a little bit better if hpreal is filtered with a Hodrick Prescott filter (smoothing parameter from 100 to 4000 makes not so much difference) and the stationary part used in the regressions.
The index (x beta from the logit) makes it possible to classify years as preceeding recessions or not (again better for recession in next 3 years and better still recession in next 5 years).
The AUC (area under the curve) statistic gets as high as 0.8 for filtered hpreal (smoothing 1600) and recession5 — 0.5 is the expected value if the classification is random (if the index is worthless) and 1 means perfect classification.
This is the star peforming correct classification frontier from
logit recession5 hpreal_1 tloansgdp lrgdp year cn* if ok, cluster(ifs)
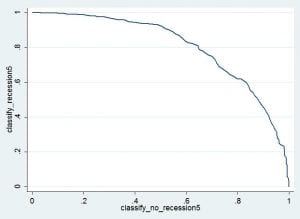
The area under the curve is the statistic called AUC and, in this case is equal to 0.8025378
Correct classification frontier was a new concept for me (it seems that doctors talk about it a lot). It is generated by starting with a very low cutoff A and saying a recession will come if xbeta>A then moving up the cutoff A. So for very low A all recessions are called so correctly classified, but all years not followed by a recession in 5 years are miss classifiied. As A slides up to infinity it goes to all non recessions are correctly classified and no recessions are correctly classified.
The curve shows that a value so that half of recessions are predicted, only 10% of years not followed (within 5 years) by a recession are false alarms.
I’ve predicted every recession of the last 30 years. Many of them I’ve predicted several years before they actually arrived – but they all came eventually, as the next one will.
Our global economy has one overarching problem: too much debt. Banker insist on being allowed to lend to the lower classes with no savings at 95% loan to value. Back in the 1920’s the terms for mortgages, if you could get them at all, were 50% down, 5 year loan. The point is, to get a loan you needed skin in the game. It incentivized you not to borrow too much, and to pay it off as quickly as possible so as to not risk the skin you had in the game. One other advantage is it kept house prices cheap. Yes, you had to scrimp for years to buy a place with a small mortgage, but at least you weren’t competing with people who were getting 95% loans.
Can we at least dispense with all but 80% LTV’s? Can we insist that people prove they also have at least six months savings before they get the loan? When banks fail, as they always will with their current low standards, it’s not the banks that suffer, it’s the holders of dollars. We end up destroying our currency. It takes decades to find out what that means to the lower classes of society, but when it comes home to roost, it is horrendous.
Ask Venezuela how that’s working out for them. Yet stupid people like John Oliver is not blaming “socialism”, but “mismanagement”, as in not accepting international humanitarian aid. What caused the inflation? Money printing. What caused the money printing? The need to fund social programs when revenue from oil dropped off and they could not float loans in international markets anymore, they had issued too much debt. Oliver’s mocking commentary is so tone-deaf it almost defies belief, but you do believe it, because at its heart, Oliver truly does not understand why Venezuela is in such straits.
Dale:
Kings versus pawns battle. The following covers all of your chain of comments in current posts.
Why would we need to print excessive amounts of currency if tax revenues were equal to government expenditure or within a few percent of expenditures? Hmmm, we don’t unless we are in recession or someone has manipulated the revenue side of the equation with tax cuts which is precisely what has happened with every damn tax break put forth by the Republicans from Reagan onward.
What trashed the US economy in 2008, was it Labor, Social programs, etc.? It was the granting of greater financial freedom to banks to invest their money on Wall Street and the investment firms getting more creative in developing investment opportunities to meet the influx of money looking for safe haven in the US. Investment Firms and banks created them and proceeded to abuse them.
Glass Steagall, or what remained of it after Greenspan started to cut the foundation from it YOY starting in 1987, till its final repeal and the change in the National Banking Act resulted in banks and investment firms (before they were banks) being given greater liberty to make money in a similar manner as to what occurred pre-Great Recession. The market will govern itself, it will have a board which will track derivatives, etc. BS, it did not and we crashed because of “irrational exuberance.” This was not mindful and safe investment with reserves set aside to cover losses. It was gambling with banking money to which Main Street made up of the same people you excoriate in your comment bailed the thieving financial criminals out and then paid for it with their jobs and savings.
There was warning in what may happen pre-Great Recession in LTCM in 1998. The Brooksley Borns and the Iris Macks of the world warned of the WMDs. The Senator Dorgan’s of our government spoke against removing the safe guards. It did not matter as the Weils, Rubins, Levitts, Gramms, and the maestro Greenspan wanted it and they even went as far as exempting Enron, an energy firm, in the act passed. The Financial Industry is too strong not unions. Your freedom is too great and you abuse your privilege.
There is way more I could put out here as to what occurred pre-2007/8, during the crash, and the pain the banks and the investment firms inflicted upon Main Street and Labor globally. The latest raise to $250 billion in assets for banks releases them from the financial reporting tethers which was monitoring their activities should never have happened for that size of a bank. Some of the banks are outright thieves.
If you create multiple comments like you just did to many posts; I will toss you.
Yes, he has the feel of a troll…time will tell. He reads like an ad.
Run,
I agree with much of what you’ve said. While banks do not create currency, they do create credit, and inflation is defined as the increase in the supply of money AND credit, per Mises.
One of the social programs created in the 1990’s was a rewrite of the Community Reinvestment Act, which put added pressure on banks to lend in low-income neighborhoods. Repealing Glass-Steagall was a disaster. Clinton also signed the Commodity Futures Modernization Act, which exempted credit-default swaps from regulation. All of these were bad, but the worst was the actual bailout. If banks were allowed to collapse, and new, well-funded banks were to be created in their stead, free of the bankers who ruined the destroyed banks, AT LEAST they would have learned a valuable lesson, that they would not be bailed out.
The unions did not trash the economy. What the unions do, however, is put fear in government that deflation of the economy will not work, that long term union contracts would lock in inappropriate salary levels for a deflating economy. If we didn’t have unions, then corporations could slash salaries if the dollar got too strong.
I don’t know who you are that says you will “toss me” for creating mutliple comments. If you’re the author and you don’t want any comments except those that agree with everything you say, just say so.
Dale:
One of the editors . . . and both Dan and I reserve that right. I will answer this later. I do not care what Mises says.