How do households build wealth
Dan here….Steve Roth in 2014
How Do Households Build Wealth? Probably Not the Way You Think. Three Graphs
Steve Roth | October 28, 2014 12:52 pm
US/GLOBAL ECONOMICS
Work hard. Save your money. Spend less than you earn. That’s how you become wealthy, right?
That’s not totally wrong, but if you think that’s the whole story — or even a large part of the story – you may be surprised by this graph:
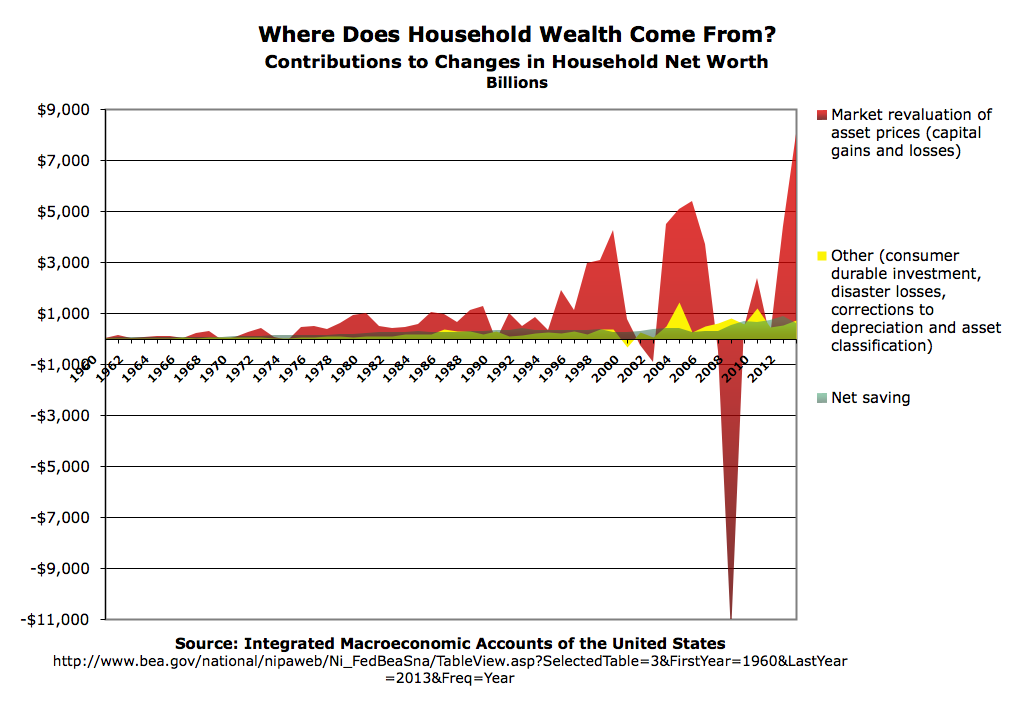
(Note: these are not realized capital gains, which really only matter for tax purposes. If the value of your stock portfolio or house goes up for twenty or thirty years, you’ve made cap gains even if you haven’t “realized” them by selling.)
Household “saving” — households spending less than they “earn” – contributes a remarkably small amount to increasing household net worth. And that contribution has shrunk a lot since the 90s.
The accounting explanation is simple: “Income” doesn’t include capital gains; it comprises all household income except capital gains. So capital gains are also absent from “Saving” — Income minus (Consumption) Expenditures. (This is why HouseholdSavings1 + HouseholdSaving ≠ HouseholdSavings2 — not even vaguely close.)
The capital gains mechanism appears to dominate the ultimate, net delivery of rewards to household economic actors. Earning more and spending less is weak beer by comparison.
What does this say about our understandings of how the economy works? Does economists’ fixation with “saving” provide a useful picture of macro flows in the economy? Since asset ownership is hugely concentrated among the wealthy (even real estate), can we think about the economy’s workings at all without looking at distribution? Does this dominant mechanism allocate resources “efficiently,” or deliver the kind of incentives that make us all better off? And etc.
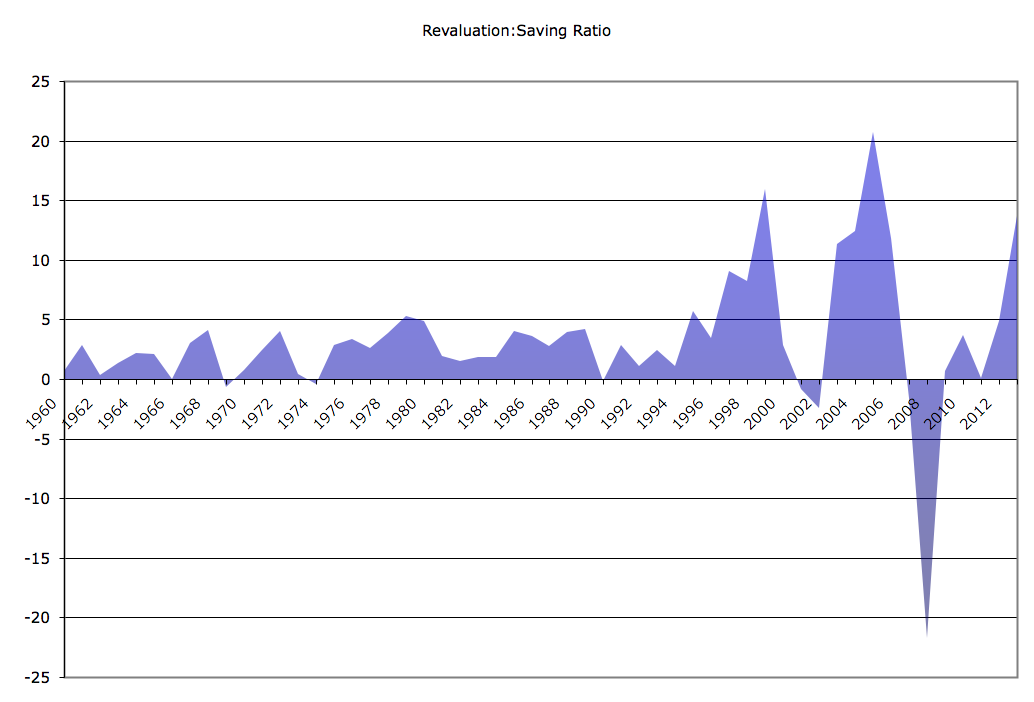
There’s much more I’d like to say about this reality, but I’ll just provide one more graph for the time being and let my gentle readers ponder the bare facts.
The spreadsheet’s here. Have your way with it. (It’s kind of messy; drop a line with questions).
Cross-posted at Asymptosis.
Which also would contribute to urban vs rural state divides. We keep housing indexes for major urban/suburban areas, we don’t bother with more rural areas for a reason.
Would be interesting to chart real home price changes by state against congressional seat gain/loss or something.
You might even be able to conclude that the “red/blue shift/purpling” of areas like Northern New England correlate with the increase in certain urbanizations becoming “bedroom communities” for denser urban areas like Boston. That push of urban workers into the cheaper residential markets on the fringe puts upward pressure on prices but also therefore generates wealth for the people already living there. I’d be confident without data to say there’s an association but how do you detangle sprawl generated wealth from average education levels etc. There is probably a feedback loop in there, and flyover country isn’t participating.
James Clavell, who wrote numerous potboilers back in the 1980s, often premised his stories on the well known fact that it is impossible to get “fuck you” money out of cash flow. “Fuck you” money is enough money to be able to say “fuck you” to your employer or any potential employer. Usually, some character or another was offered a chance to earn a such a pile of money, and the story flowed from there. Saving a few dollars a day wasn’t going to do it. Even economists admit this when they emphasize the importance of savings, but only thanks to the power of compound interest. If your money isn’t earning money, then, odds are, you aren’t earning money, at least not money that counts.
If anything, this has gotten worse, since pay for work has stagnated or fallen for most people, and we’ve seen the rising value of asset ownership. I figured this out during the recession in the early 1990s when a poor economy was accompanied by a booming stock market. I should have recognized it back in ’86 when the market dropped suddenly, then nearly instantly recovered. The value of ownership no longer had anything to do with the productive value of the assets. It was simply a place to park money if one had money to park. I suspect that if we ever move back to an economy that values work again, asset values will be more dependent on their productive capacities.
Economists are ideologues, and the facts run counter to their limited ideologies, so I don’t expect this realization to be incorporated into any mainstream economic theory soon. While unfortunate for the world economy, this makes it easier for me as an investor. Anyone serious about understanding this should read a bit of ‘The Theory of Peasant Economy’ and then consider writing a corresponding ‘The Theory of Aristocratic Economy’ as the two would complement each other.
Savings by the lower and middle class has to be divided into “near term” and “long term” savings. The later is savings to acquire a home down-payment or a dream vacation someday, or a 2nd vacation home or other income producing real estate. Such savings may be invested in very safe assets for a slightly greater return than on bank savings accounts.
Short term savings is to cover back to school clothes for the kids, xmas, next years vacation, a new car (better car) in a couple of years out to maybe 5 or 8 years, or covering a period of possible unemployment. Short term savings is rarely invested in anything .. and so earns near nothing in bank savings accounts.
Thus it should be obvious that most households don’t built wealth at all… they build ability to consume on a delayed basis. Even owning a home with a fat mortgage payment is only worth as much as you can pay back (interest and principle) on a home equity loan which is just another form of immediate consumption with immediate debt, so net worth doesn’t change nor does consumption capacity over the medium term… it’ a bigger credit card is all
Note I said “MOST” households. If you’re in the top 20% of annual incomes you’re far, far from MOST households. You have to distinguish savings by income decilles, and within them by short and long term savings vs investments…. i.e risk driven returns.
If you want to build wealth it is important to take your savings and invest it in something productive. Savings is much more important than these graphs show because your savings today will grow in a compounding rate over time.
One major reason why the change in capital valuations is so much larger than savings is that every year the capital “gains” that match the first 2% of the net capital stock are not really gains, but simply an upward adjustment in monetary valuation to keep up with inflation. You are no wealthier with $102 in capital assets today compared to $100 a year ago when inflation was 2%. You are certainly wealthier if in the last year you earned $2 more than you spent.